The eternal battle of finance has a new playing field: the crypto market. It’s not about which book you read, but about how you see the world. Are you one of those who dive into the numbers, the balance sheets, the news, the technology, and the project behind each token, or are you one of those who read the past, the candlesticks, and the patterns on a chart to predict the future?
This is not a theoretical class, it is a guide for you to discover your own strategy and take control of your decisions. There is not just one path, there are two powerful philosophies, and the choice is yours.
Technical Analysis: The art of reading the market (Without asking for permission)
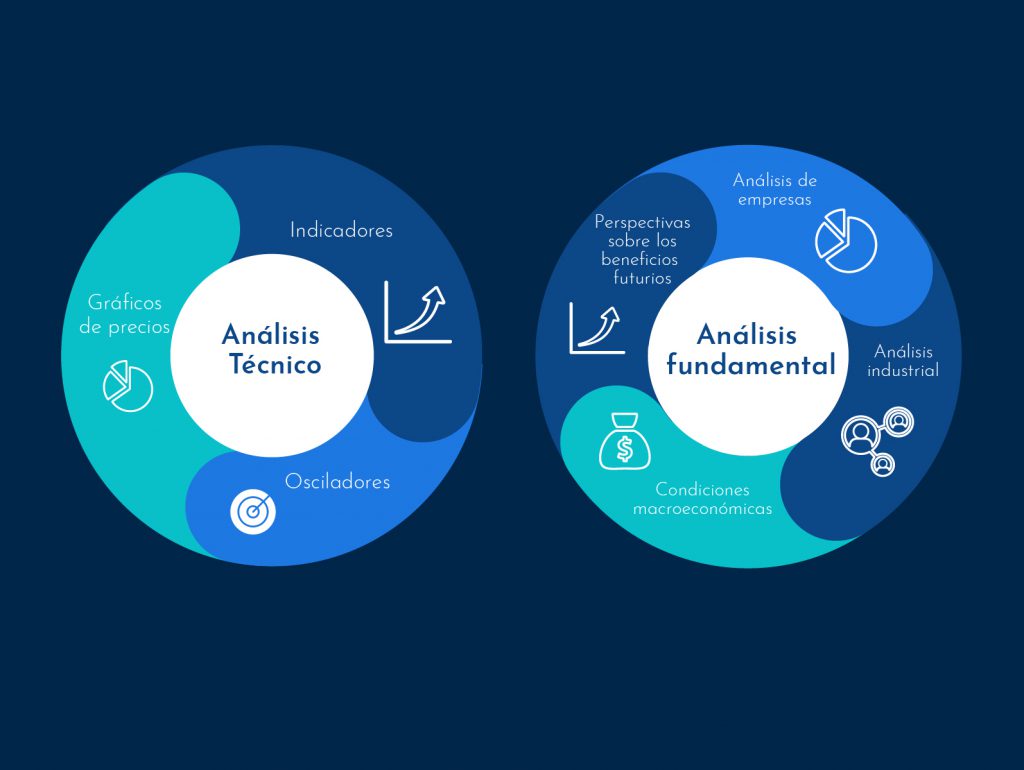
Discover the power of technical analysis and transform your way of operating in financial markets. So, technical analysis is the study of investor behavior and its effect on price movements in the markets. The main tools used in technical analysis are charts and indicators. Charts are visual representations of price movements, while indicators are different approaches to reading the information provided by the charts.
Now, do you struggle to understand when to buy or sell an asset? Technical analysis can be your best ally. This tool allows you to read charts as if they were maps: you identify patterns, detect trends, and act with greater precision.
In essence, it is not concerned with the “why” an asset goes up or down, but only with the “where” it is heading, using price and volume as its only tools.
Origin and fundamental principles
Although some elements of technical analysis are hundreds of years old, Charles Dow is considered the pioneer of technical analysis in the early 20th century. As the founder of Dow Jones & Company, he created the Dow Jones Industrial Average in 1896, which was the first index of its kind to track the performance of the US stock market. As markets matured and more sophisticated analysis methods developed, the field of technical analysis emerged.
5 key points
- Technical analysis focuses exclusively on past price and volume movements.
- It uses tools such as charts, indicators, and Japanese candlestick patterns.
- It identifies trends, key support and resistance levels.
- It is based on the repetition of historical patterns and market behavior.
- It is applicable to any financial market, such as stocks, forex, or cryptocurrencies.
In fact, technical analysis helps simplify complex markets by studying patterns. It is not about predicting with certainty, but about identifying opportunities with a high probability of success, making it an essential tool for those who wish to master the art of trading.
Very importantly, although technical analysis is a popular method for traders to select when to open or close a position, it is important to remember that there are no guarantees of success. Traders should use technical, fundamental, and other types of analysis to manage risk and form a more complete understanding of underlying market conditions.
The rebel’s tools: Candlesticks, indicators, and charts
The “rebel’s tools,” in a trading context, refer to Japanese candlesticks, indicators, and charts, which are fundamental for analyzing the price movements of financial assets and making investment decisions. Candlesticks show open, high, low, and close prices, while indicators offer additional data and charts present the information visually.
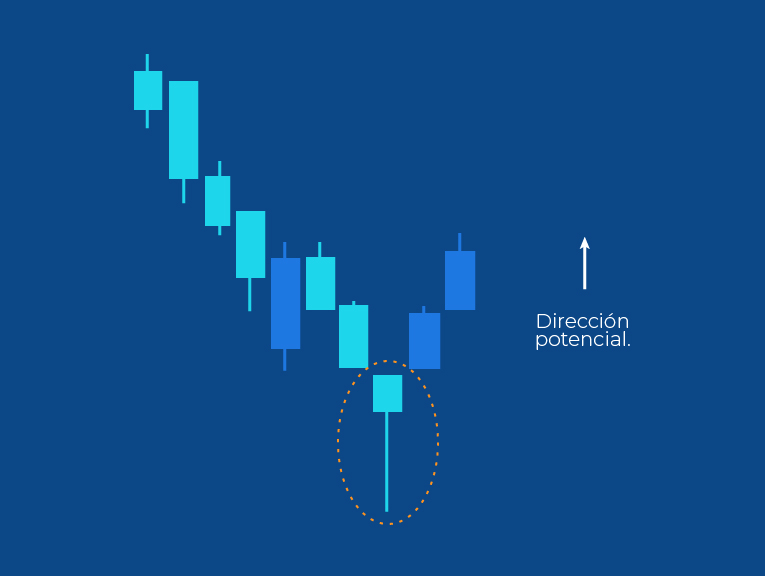
- Japanese Candlesticks. They are the footprints the market leaves in time. They offer a simplified way to visualize the price movement of an asset over a period of time. They clearly show the changes between the opening and closing price of an asset in a given time interval, including the highest highs and lowest lows. Each candlestick on the chart represents a segment of time. Traders can set the time intervals for the candlesticks so that each one represents a minute or even a year of activity.
- Indicators. They are your eyes on the battlefield. They are invaluable tools for analyzing market trends, momentum, or volatility and making informed decisions. They help confirm signals from candlesticks and charts, offering a more complete view of price behavior and market psychology.
- Charts. They are your war map. They are visual representations of price data over time. They allow you to visualize patterns and trends quickly, making it easier to interpret the information provided by candlesticks and indicators.
Fundamental Analysis: Because numbers do matter (When you understand them)
If technical analysis is for those who read the tracks, fundamental analysis is for those who dig deep. You forget about charts and short-term trends, because your goal is to discover the real value of an asset, the one hidden behind the daily market volatility. You are a detective who does not trust the “price lies,” but seeks the truth in the data.
Origin and fundamental principles
This philosophy was popularized by Benjamin Graham and David Dodd in the 1930s. Their premise was simple but revolutionary: the value of a company is much more than its stock market price. They believed that if you investigate thoroughly, you can find assets that the market has “undervalued,” offering a unique opportunity to invest with a margin of safety.
Fundamental analysis is based on the idea that, in the long term, the price of an asset will always tend to reflect its intrinsic value.
To reach that truth, three main areas are studied:
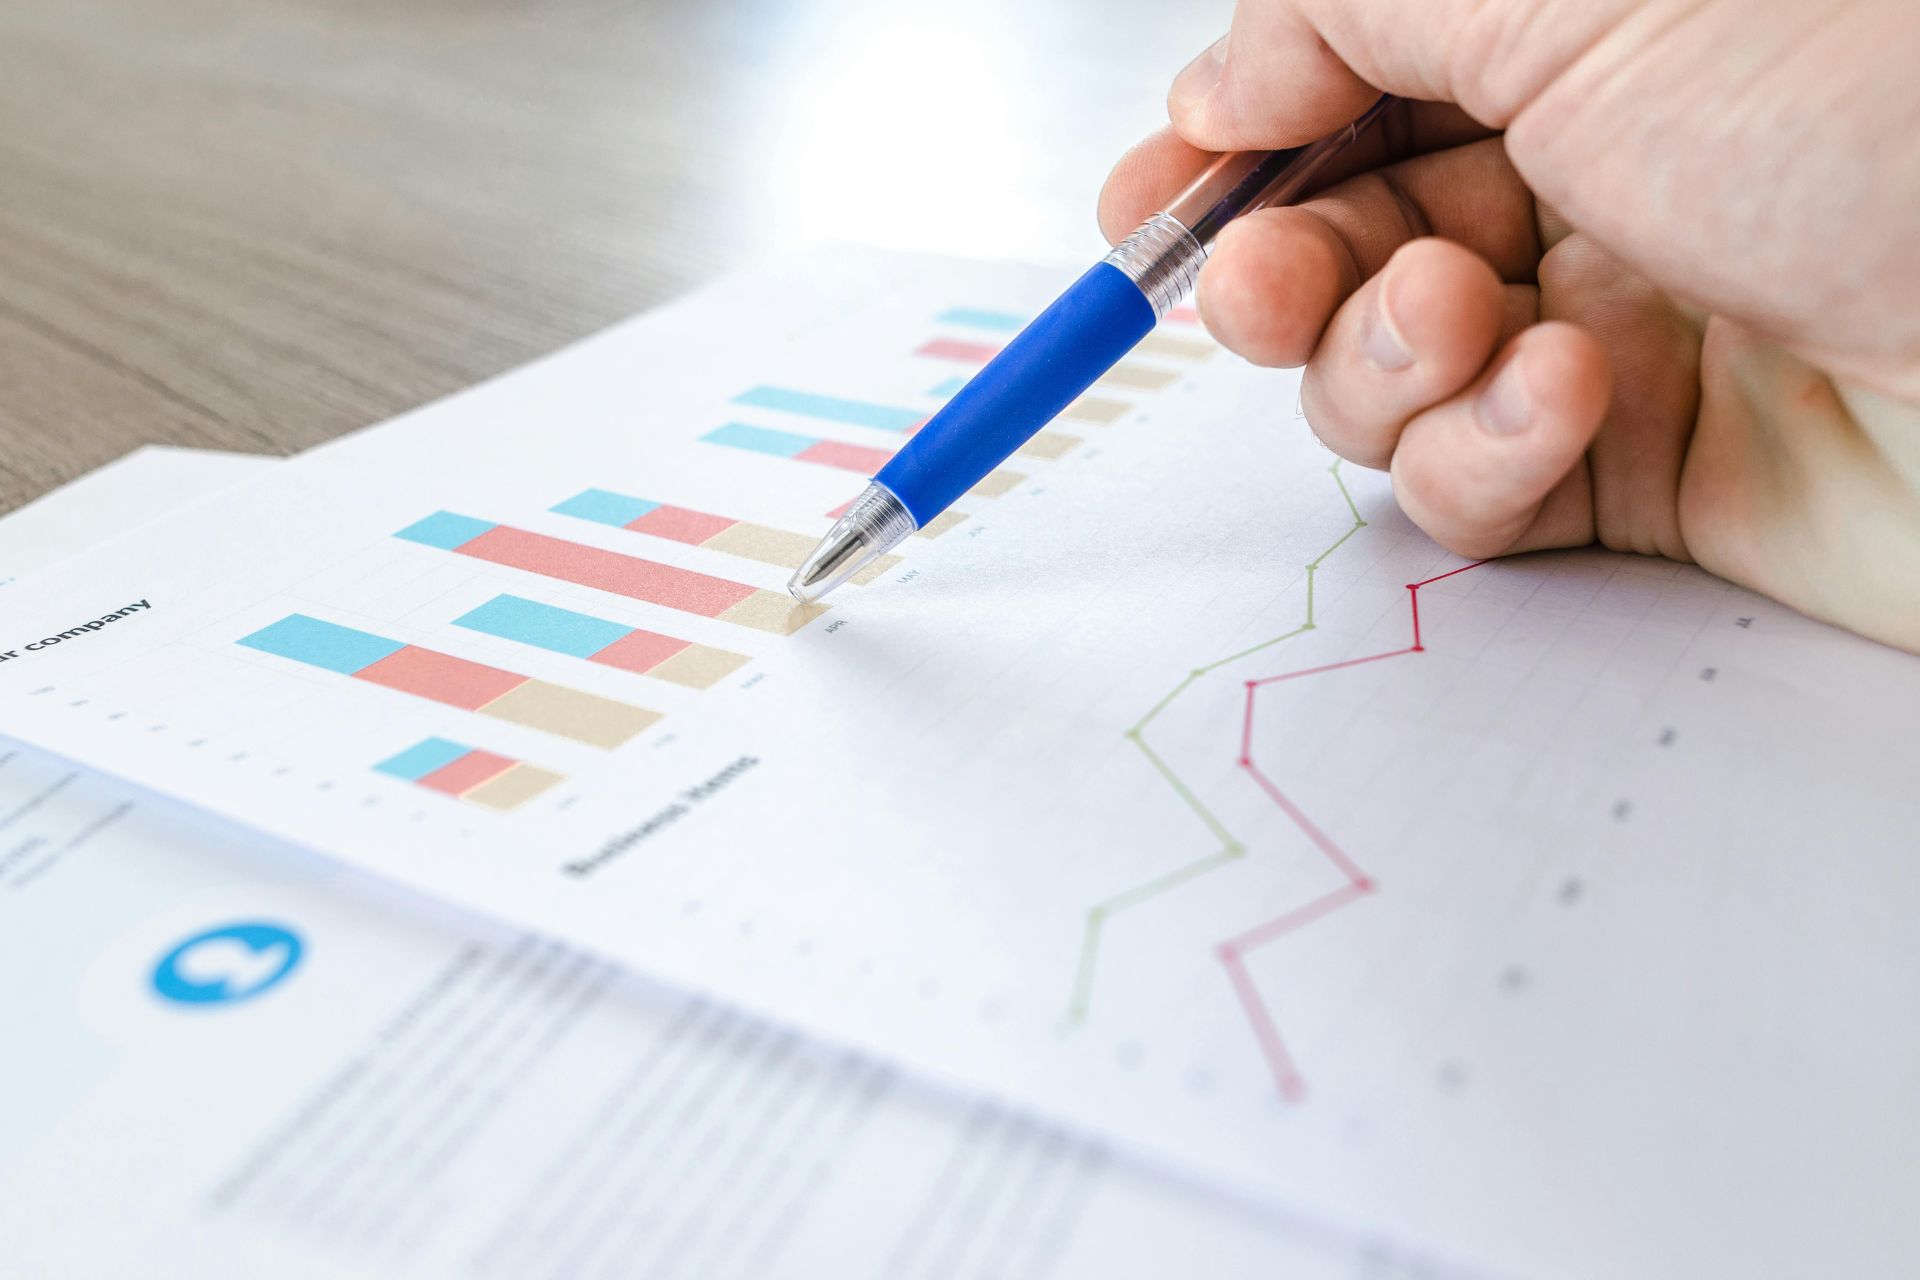
- Analysis of financial data. You become an accountant. You examine balance sheets, income statements, and cash flow statements to understand a company’s financial health. You look for solidity in its profits, debts, and assets.
- Analysis of the environment. You are a strategist. You evaluate the sector, the competition, economic news, and political events. You ask yourself: does the company have a competitive advantage? How will changes in the market affect it?
- Company valuation. You are an appraiser. With all the data, you calculate the real value of the company to compare it with its current price. If the price is much lower, you have found an opportunity.

Basically, fundamental analysis is the tool of the patient investor. It frees you from the need to constantly watch the market. It allows you to make decisions based on solid data, not on panic or collective euphoria. When you find an asset with a real value higher than its price, you don’t care if the market moves against you in the short term, because you trust that, eventually, the truth of the numbers will prevail.
Key differences between Technical and Fundamental analysis
Having explored the fundamentals and tools of technical analysis, it is essential to compare it with its most common counterpart: fundamental analysis. Both approaches seek to understand the markets, but they do so from very different perspectives. Below, I present a clear and precise table to highlight the key differences between them:
| Aspect | Technical Analysis | Fundamental Analysis |
| Main Focus | Study of price charts and historical patterns. | Evaluation of the financial fundamentals of a company or economy. |
| Objective | Identify price trends and patterns to predict future movements. | Determine the intrinsic value of an asset to identify if it is undervalued or overvalued. |
| Key Tools | Technical indicators (RSI, MACD, moving averages), trend lines, supports and resistances. | Financial reports, income statements, market analysis, macroeconomic reports. |
| Time Horizon | Short and medium term; focuses on immediate market changes. | Medium and long term; ideal for sustained investments over time. |
| Basic Assumption | The price discounts everything and moves in trends that tend to repeat. | Prices eventually reflect the real fundamentals of the company or economy. |
| Main Users | Active traders | Long-term investors and financial analysts. |
| Applicable Markets | Stocks, forex, cryptocurrencies, commodities, among others. | Mainly stocks, bonds, and economic sectors. |
| Applicable Markets | Stocks, forex, cryptocurrencies, commodities, among others. | Mainly stocks, bonds, and economic sectors. |
The DNA of a project: Tokenomics, team, and community
Traditional fundamental analysis focuses on financial statements and company balance sheets, but in the world of cryptocurrencies, “value” is different. There are no balance sheets, no quarterly earnings. Here, the fundamentals are in the heart of the project.

To evaluate a crypto project fundamentally, you must become a detective who investigates the project’s DNA. Your mission is to discover if the asset has a solid foundation or if it is just an empty promise.
- Tokenomics. It refers to the design, structure, and functionality of tokens within a blockchain system. By shaping user behavior and establishing a financial model, tokenomics plays a crucial role in the success or failure of a project.
- The Team. The team behind a project is its engine. Investigate the founders, developers, and advisors. Look up their profiles on LinkedIn or check if they have worked at other technology companies or relevant blockchain projects. A good team has a clear plan.
- The Community: The life force. A strong community is the fuel that drives a crypto project. It tells you if the project has real adoption beyond the numbers. Observe the activity on its social networks, forums, and chat channels. Look for adoption metrics like the number of active addresses or the transaction volume on the network to see if the project has real users.
Understanding these three pillars gives you the power to see beyond the price and make informed decisions, becoming an autonomous investor in the volatile crypto market.
What if you don’t have to choose? The combination that changes everything
Indeed, the reality is that this is not a battle, it is a synergy. The most successful traders often combine both methods to have a 360-degree view of the market. They use fundamental analysis to decide WHAT assets to trade (solid projects with potential) and technical analysis to determine the WHEN (the ideal time to enter or exit the market).
By the way, combining both analyses allows for a complete and well-founded strategy.
- Use Fundamental Analysis to decide the “WHAT”: Identify crypto projects with strong intrinsic value and long-term potential. It is your quality filter.
- Use Technical Analysis to decide the “WHEN”: Use charts and indicators to find the optimal entry and exit points. It is your timing tool.
In the end, the war of methods is not real. It is an invitation for you to combine the best of both worlds to become a smarter and more confident investor or trader. What will you do with these tools now that you know you don’t have to choose?
Conclusion: Be the owner of your strategy
We have navigated the war of methods, from the detectives of numbers to the readers of patterns. However, the most important lesson of all is that true financial freedom is not about following a guru or depending on a manual, it is about taking control, the key is that your strategy is yours. Every decision you make, every analysis you perform, takes you one step away from intermediaries and closer to autonomy.

In a market as dynamic as cryptocurrencies, true rebellion is not just investing, it is understanding what you are doing. It is arming yourself with knowledge to make decisions on your own, without intermediaries telling you what to do.
Now that you have the tools, are you ready to start writing your own story? Or as Warren Buffett says: “The goal of an investor is not to guess market trends, but to obtain consistent profits through solid investments.”