Developed by J. Welles Wilder Jr. and widely disseminated in his book, published in 1978 “New Concepts in Technical Trading Systems”. This indicator has withstood the passage of time, and is currently present as a tool in most trading or technical analysis platforms.
Its meaning comes from its own name, Relative Strength Index, which is translated into Spanish as Índice de Fuerza Relativa. It is one of the main technical indicators, and its purpose is to measure the buying force and the selling force of a financial instrument, such as contracts on currencies traded in Forex.
The RSI takes values between 1 and 100. It shows the strength of the price by comparing the individual upward or downward movements of the successive closing prices.

How does the RSI work?
The Relative Strength Index (RSI) compares the strength of a security on up days with the strength on down days. Relating the result of this comparison with the price action can give traders an idea of the potential performance of a security.
Actually, this tool serves to measure both the speed in price changes, as well as the possible levels of overbought or oversold. Its use can vary greatly depending on the implementation given by each trader within their strategy.
However, the basic principles, from which any way of using the RSI in Forex or other markets are derived, are:
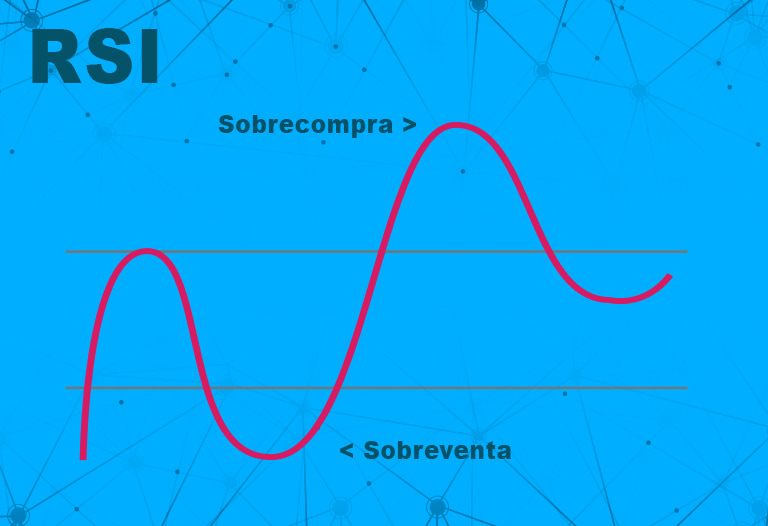
- RSI around the level 30.Indicates that the price could be entering oversold, product of a sharp fall, and that it should soon begin to lose force.
- RSI around the level 70.Exactly the opposite of the previous case. It is possible that the price has presented a sharp increase, and should soon begin to lose force in that direction.
- Around the level 50.The market is fluctuating laterally, at least in the timeframe from which it is being observed.
Calculation and operation of the RSI
The formula to calculate the RSI is quite simple. The reason we share the calculation is not that you have to calculate it manually. We show you the formula so you can understand the underlying mathematics and the market data approach, however, to trade based on it you do not need to know the exact RSI calculation, you only need to understand what it indicates.
RSI = 100 – 100 / (1 + RS)
Now, the RS is the average of the absolute upward price changes divided by the average of the absolute downward price changes over the most recent 14 periods/candles.
This shows that the price change is the basis of the RSI indicator. In effect, the RSI measures the strength of upward movements against downward movements in the period in question. The standard RSI period is 14 and we recommend that you maintain the standard RSI setting. The RSI setting for cryptocurrencies is the same as for any other type of market.

Interpretation of the RSI
The interpretation of the RSI is crucial for making informed decisions. An RSI above 70 can indicate that the index is overbought, which could be a sign that it is time to consider selling. On the other hand, an RSI below 30 can suggest that the index is oversold, which could be a signal to buy.
However, it is important to keep in mind that the RSI should not be used in isolation. It is advisable to combine it with other technical indicators and trend analysis to get a more complete view of the market.
Next, we will see simple and clear examples so you feel confident applying it in your analysis.
You are seeing a stock that moves between $10 and $12:
- RSI at 90.The stock is at $12. The RSI screams at you: “Sell! It is overbought and at the top of its range!”
- RSI at 10.The stock is at $10. The RSI screams at you: “Buy! It is oversold and at the bottom of its range!”
The price of Ethereum has been falling strongly for the last two days.
- Price action.The price of ETH falls from $3,500 to $3,000.
- RSI reading.On the 4-hour chart, the RSI falls to 18. (It is far below the 30 level).
- Simple interpretation.The market is “oversold”. The selling was exaggerated and the sellers are exhausted. The price is likely to bounce soon.
- Trader’s action.The trader decides to buy ETH at $3,000 or set a buy order slightly above, anticipating that the elastic band will return to its position.
- (Desired) Result.The RSI quickly rises from 18 to 40, and the price of ETH bounces to $3,200. The trader sells and makes a quick profit.
How the RSI is applied in cryptocurrencies
Indeed, the RSI is a momentum indicator. It measures how much and how fast the price of a particular cryptocurrency changes. It also indicates if the cryptocurrency or the stock is becoming oversold or overbought. That information helps traders decide the direction of their trades.
Key advantages of the RSI in crypto trading
The cryptocurrency market operates 24/7 and is known for its fast and sometimes dramatic movements. The RSI is perfect for this environment for the following reasons:
- Ideal for extreme volatility.Cryptocurrencies quickly pass from a state of euphoria (rise) to one of panic (fall). The RSI detects these extreme conditions (overbought or oversold) with great clarity, allowing you to enter or exit before a correction.
- It works on all time frames.You can use the RSI for short-term trading (15-minute or 1-hour charts) or for long-term investments (daily or weekly charts). The signal is consistent.
- Detection of trend exhaustion.In a parabolic bullish (or bearish) run, the RSI is the first to warn you that the momentum is running out, even if the price continues to rise.
Nevertheless, relying solely on the RSI can be risky, especially in volatile markets like cryptocurrencies. It is essential to combine the RSI with other indicators or price action analysis for confirmation.
In this way, you can increase the chances of identifying favorable market conditions for profitable trades. In conclusion, if you understand how to calculate and interpret the RSI, you will be able to navigate market fluctuations with greater confidence and improve your trading strategy.
Practical cases
We present you some examples of the RSI, focused directly on the cryptocurrency market, where volatility is king.
- Extreme panic (Oversold): Time to buy Bitcoin. In the crypto world, falls are often exaggerated and fast. The RSI helps you detect when the panic has gone too far.
- Bitcoin falls from $100,000 to $90,000 in one day due to bad news.
- RSI Signal. The RSI on the 1-hour chart plummets to 18 (far below 30!).
- Simple interpretation. The selling is extremely exhausted. The price is momentarily a bargain due to panic.
- Trader’s action. You dare to buy BTC at $90,000. You use the RSI to be brave when everyone else is scared, expecting a quick bounce.
- Deceptive euphoria (Bearish Divergence). Time to sell Ethereum.The RSI protects you from buying just when everyone else is euphoric and the price is about to fall.
- Ethereum (ETH) has a strong rise.
- ETH reaches $3,500 and the RSI reaches 78 (A lot of strength).
- ETH continues rising to $3,700, but the RSI only reaches 65.
- Simple interpretation. The price rose, but the engine lost power. There is less force behind the last rise, which is a warning that the bullish trend is dying.
- Trader’s action. You sell your ETH (or open a short position). The RSI helped you detect the trap at $3,700, avoiding you losing money in the correction that will come after.

Comparison of the RSI with other technical indicators
Traders often use the RSI along with other indicators, such as moving averages and the MACD (Moving Average Convergence Divergence), to improve market analysis and support decision-making. But which of these indicators works best? We will make a comparison to determine which one could be more useful in different trading contexts.
| RSI/Moving Averages | RSI/MACD | |||
| RSI | Moving Averages | RSI | MACD | |
| Focus | It is a momentum oscillator | They are trend indicators | Both are momentum oscillators but they calculate different aspects of the price movement | |
| Function | Identifies overbought/oversold and potential price reversals | They smooth the price to identify the long-term trend direction and detect potential trend crosses | Measures the speed and strength of price movements in relation to previous periods | Shows the relationship between two moving averages to identify changes in the strength, direction, and momentum of the trend |
| Complement | The RSI can confirm or refute the signals generated by the moving averages, helping to identify the real strength of the trend | Using the RSI together with the MACD can provide more solid confirmation of the trend | ||
Divergences between the RSI and the price
Normally an indicator will behave exactly the same as a price curve, but there are moments in the market when the price and indicator make different movements. This fact is known as divergence.
A divergence in trading occurs when the price movement of a financial asset is not in tune with the behavior of a technical indicator.
In simpler terms, we speak of a discrepancy between what the price shows and what certain indicators like the RSI or MACD reflect. This phenomenon can be an early signal of a possible change in market trend.
When a divergence is identified, we are facing a possible warning signal. This pattern does not guarantee an immediate change in market direction, but it does indicate a discrepancy in the underlying momentum.
For example, if during a bullish trend we identify a bearish divergence on the chart, this could be a warning that the buyers are losing strength and the sellers could take control.
Bearish and bullish divergences
Divergences can be bullish (buy signal) and bearish (sell signal).
- Bullish Divergence.When the price lows of the asset are progressively lower and conversely the equivalent lows of the RSI are progressively higher.
- Bearish Divergence.A bearish divergence exists when the price highs of the asset are progressively higher and conversely the equivalent highs of the RSI are progressively lower.
Using the RSI to identify trends
The RSI is a fantastic tool not only for detecting overbought or oversold, but also for confirming the strength and health of a trend or, crucially, identifying when that trend is about to exhaust itself! Using the RSI in this way empowers you, giving you the confidence to know whether you should hold your position or prepare to exit.

When RSI values are above 50 it indicates that the average of gains is greater than the average of market losses (bullish trend). On the other hand, readings below 50 indicate that the average losses are larger than the average gains (bearish trend).
It is important to mention that when we use the RSI to measure the trend, it is advisable to use more periods, such as an RSI (40) or an RSI (50).
It is always important to keep in mind that the use of these indicators is more an art than an exact science, overbought and oversold conditions can anticipate a short-term adjustment, although they can also be a sign of strength in the medium-term trend.

Therefore, the interpretation of the data must be done in the context of the general price action, and of the time horizon of the operation.
Limitations and considerations of the RSI
Despite being a popular technical analysis tool, the RSI has some limitations or drawbacks:
- The RSI can often move without showing a clear trend for a long timein a market that is moving sideways. In such circumstances, other indicators might be more useful.
- The results of the RSI can be misleading when there is a clear trend in the market.Therefore, it should only be used in a variable market. Generally, it is better to combine several technical indicators rather than limit oneself to one.
Because of this, it is essential to be clear and realistic when using the RSI. While it is a powerful indicator, it is not an infallible crystal ball. Knowing its limitations is what will allow you to use it more intelligently and with greater confidence.
To conclude, it is very important that you keep in mind that both the RSI and other technical oscillators are tools that usually nourish your trading strategy. However, it is necessary to maintain discipline when trading, and as mentioned, always be prepared for the surprises that the market may present you with. Or as Philip Fisher indicates: “The stock market is full of individuals who know the price of everything, but the value of nothing.”